
August 28, 2025/
Discover the top WordPress web design trends. Learn how businesses can boost SEO, user experience, and conversions with the latest design...


Discover the Power of Data-Driven Decisions
At NarmafzarSolutions.com, we transform complex data into clear, interactive insights through dynamic dashboards and intuitive visualizations. From healthcare to finance, education to public services, we help organizations monitor key metrics, uncover trends, and make faster, smarter decisions—no matter the industry.

Our visualizations do more than present data, they reveal meaning, spark action, and support confident decision-making. Thoughtfully designed with clarity and usability in mind, each dashboard combines intuitive interaction with purposeful storytelling to spotlight what matters most. Built with a foundation of security and scalability, our solutions flex to fit any industry and evolve with your business. From tracking key metrics to uncovering complex insights, our visuals help you grasp information quickly and make smarter moves with confidence.
Our dashboards are designed for everyone—from data analysts to decision-makers. Filter, drill down, and explore without writing a single line of code.
Every visualization is crafted with your unique objectives in mind. We design around your KPIs, processes, and workflows for maximum impact.
Whether you're a startup or a global enterprise, our solutions scale with your data and your business, no limits, just growth.
See how we bring data to life across industries. From sales and marketing to healthcare and finance, our dashboards showcase the power of visual insights, clear, interactive, and designed to drive smarter decisions.
Understand revenue patterns across regions, products, and time. Drill down into team performance, customer acquisition, and sales cycle efficiency.
Monitor patient volumes, appointment wait times, and bed occupancy rates. Visualize departmental performance and optimize staffing based on real-time demand.
Track readmission rates, treatment effectiveness, and patient recovery trends. Use data to support compliance and improve quality of care.
Track inventory levels, fulfillment times, and vendor reliability. Optimize your supply chain with smart visual indicators.
Segment your audience, monitor churn risk, and visualize customer journeys with easy-to-read funnels and behavior heatmaps.
Maintain budget alignment and control spending with centralized insights into P&L, forecasting, and overall financial performance.
Evaluate campaign ROI, channel performance, and audience engagement. Make data-driven marketing decisions backed by real-time metrics.
Visualize student progress, attendance, and engagement across departments. Great for institutions focused on improving academic outcomes and operational efficiency.
Track employee retention, hiring trends, and engagement survey results. Support data-backed decisions on organizational development.

We make data more understandable and actionable, so your team can move quickly, make informed decisions, and stay ahead.
Live chat is available now — get instant answers to your questions.

Stay up to date with our latest articles featuring insights, innovations, and global trends.
Discover the top WordPress web design trends. Learn how businesses can boost SEO, user experience, and conversions with the latest design...
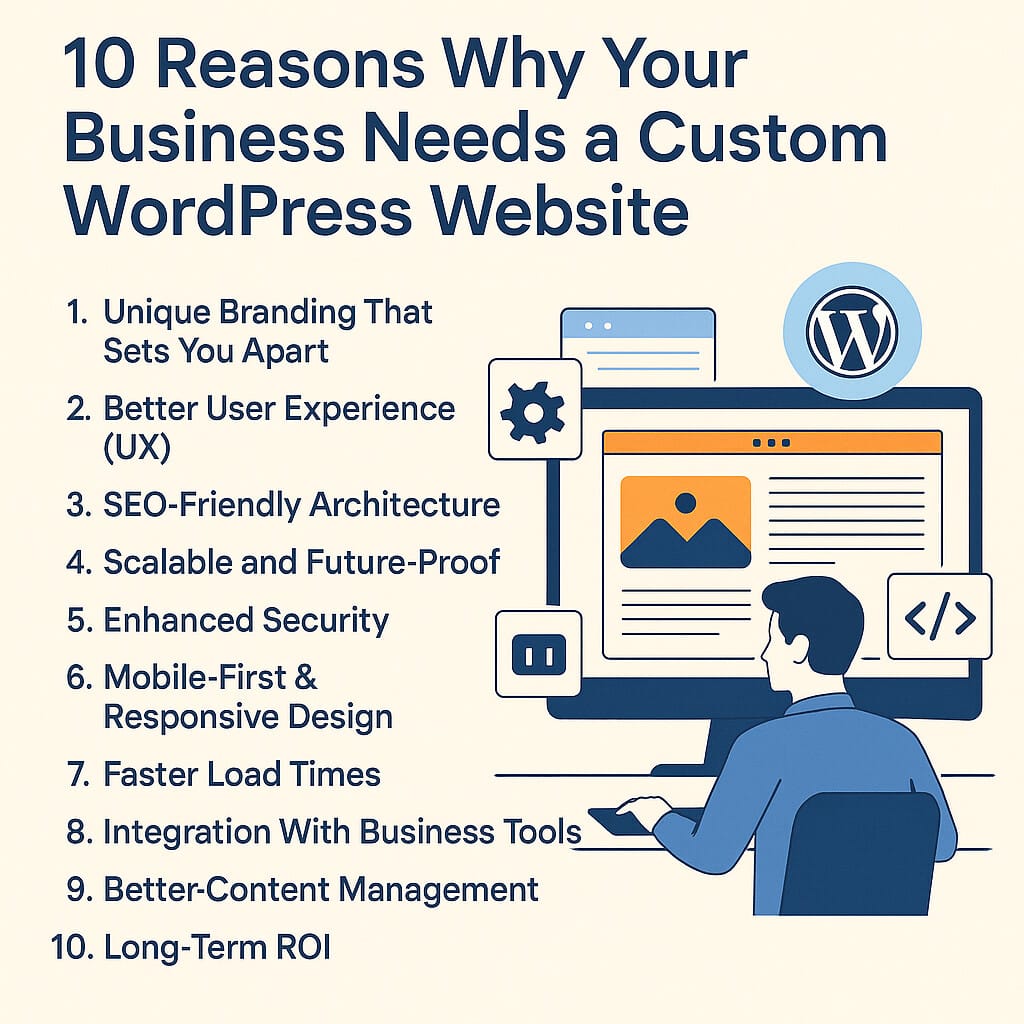
Discover the top 10 reasons why a custom WordPress website is essential for your business. Learn how custom design boosts SEO,...

Understanding Software Outsourcing Software outsourcing involves hiring external teams or agencies to take on software development tasks instead of managing them...